Living Arrangements trends in the United States
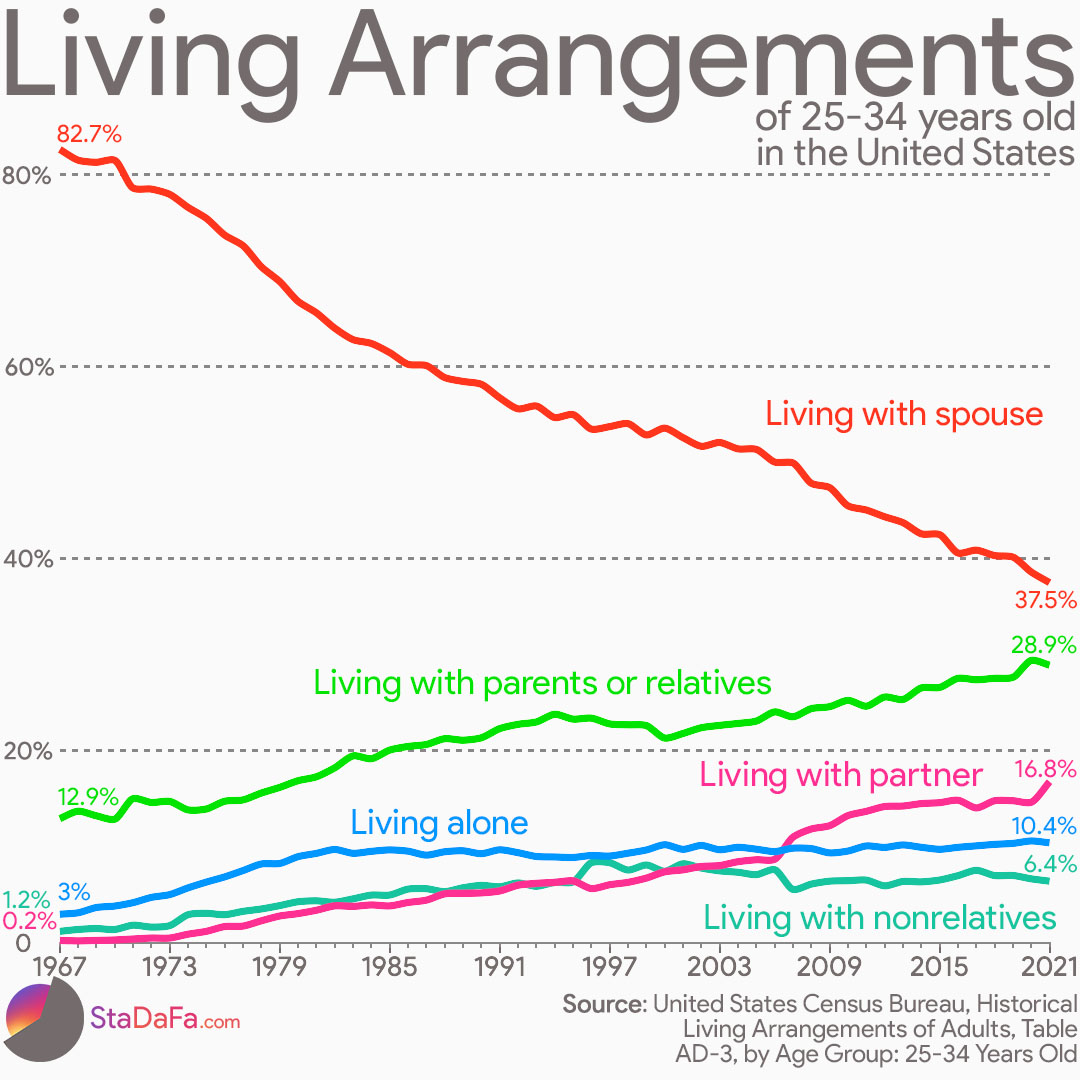
This week we take a look at living arrangements trends in the United States, for people aged 25 to 34 years old.
The data collected from the US Census Bureau starts from the 1960s and reaches up to 2021. As you can clearly see, a lot has changed regarding people's housing arrangements in the United States during these past 50+ years.
The percentage of married people living with their spouse has seen the biggest change over these years. In 1967 a whopping 82.7% of Americans aged 25-34, lived in a household with their spouse, whereas now, the percentage has dropped by more than half, to 37.5%. And it's not just that people nowadays opt out of marriage, and instead choose to live with their partners out of wedlock.
The percentage of people in their late 20s and early 30s living with parents or relatives has also increased more than twofold, from 12.9% in 1967, to 28.9% today.
Living alone has also increased from the 1960s, albeit considerably more slowly, and has remained at around 10% since the early 80s.
In the 1960s, it was almost unthinkable to be in the 25-34 age range and live with a partner without being married. Just 0.2% of the population did so, whereas today 1 in 6 people choose to do so, with 2021 seeing a considerable uptick.
Living with a roommate, or a non-relative as is the term the US Census Bureau uses, has seen its ups and downs. In 1967 the percentage of people living with a non-relative was 1.2%, it reached a high of 8.2% in 1996-1997, and then it gradually came down to 6.4% today.
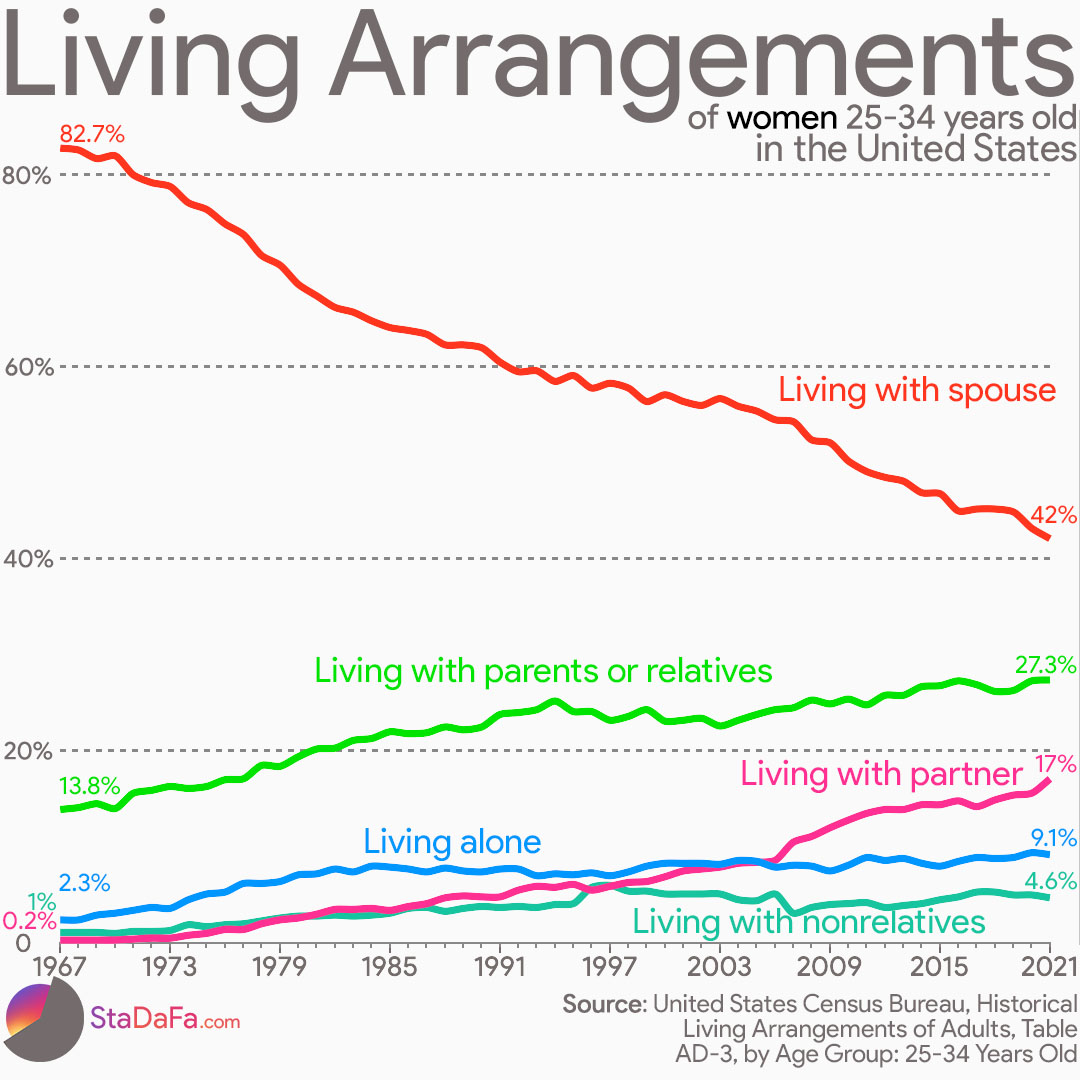
Of course, there are considerable differences between males and females.
You can find a side by side comparison as well as individual gender graphs below.
As is clearly evident, in 1967, both men and women had about the same living arrangements. The only thing worth mentioning is that the percentage of men who lived alone was slightly larger, and the same thing happened with women who lived with relatives. If you subtract men living alone with women living alone, you get about the same percentage as the difference between women living with relatives and men living with relatives.But things look very different now. 42% of women in their 25-34 live with their spouse, while only 33% of men. From this, we can deduct that men nowadays get married older with spouses younger than them.
As we saw above, in 1967 women were more likely to still live with their relatives than men were. Now, even though the percentages of people living with their parents have more than doubled, the percentage of women who live under the roof of their relatives is 27.3% while the percentage of men is 30.5%. That can be explained by the fact that nearly half of the women have gotten married by that point in their lives, while only 1 in 3 men has done the same.
Another interesting difference between the two genders is that nearly double the men live with a roommate than women do.


Comments
Post a Comment